Free Access
Figure 1
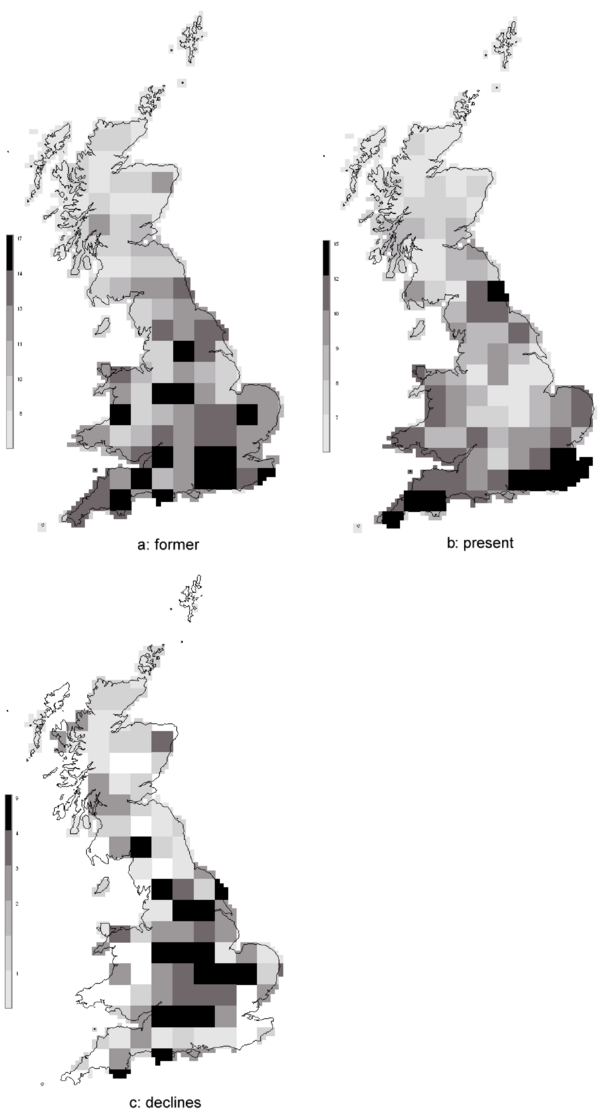
Maps of regional species richness for British bumblebees (excluding Psithyrus, which have a different, parasitic ecology) among 50× 50 km grid cells from the BDMS data (Alford, 1980) used to examine range reductions, for: (a) ‘former’ richness (pre 1960 and 1960 onwards records combined); (b) ‘present’ richness (1960 onwards records); (c) declines in richness (pre 1960 records only). Equal-frequency grey scale classes (left of each map) representing relative species richness are used to maximize differentiation among regions. Reproduced from Williams P.H. (2005).