Free Access
Figure 4
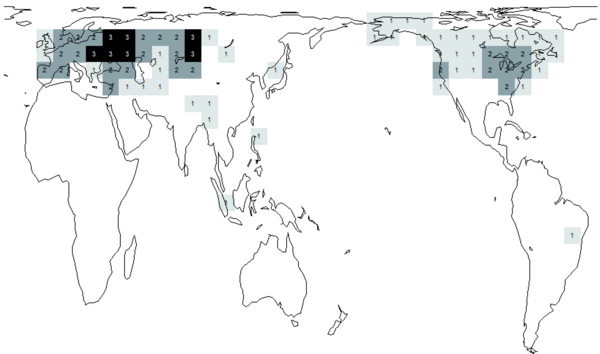
Map of the world (excluding Antarctica) plotting counts of the numbers of species from the categories EXTINCT, CRITICALLY ENDANGERED, ENDANGERED, and VULNERABLE from Table I on an equal-area grid (area of each c. 611000 km2). Grid cells are scored as occupied by a species for its total known and expected historical native distribution, not for its current distribution. Cells are defined by intervals of 10 ° longitude and by varying intervals of latitude (bumblebee data updated from Williams P.H., 1998). Cylindrical equal-area projection.