Free Access
Figure 3

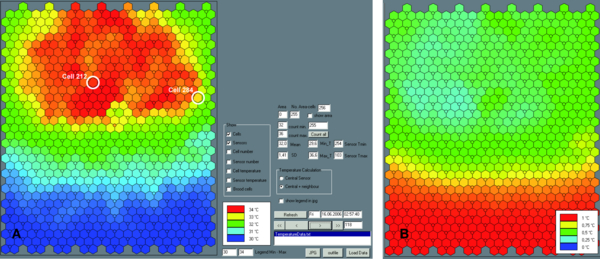
(A) Recorded temperature data are analyzed and displayed via a visualization software. Shown here is a snapshot of the temperature distribution on June 16, 2006, 2:57 a.m. with brood being present in the upper part of the comb (red and green area). For the cells No. 212 and No. 284 the temperature profile is given in Figure 4. The software also provides fundamental statistical values (mean temperature, standard deviation, minimum and maximum temperature, number of cells in a given temperature range). (B) The standard deviation of cell temperatures from 16.-24.06.2006. Temperature fluctuations are strongly reduced in the upper part of the comb, where the broodnest was located (blue and green area).


