Figure 1
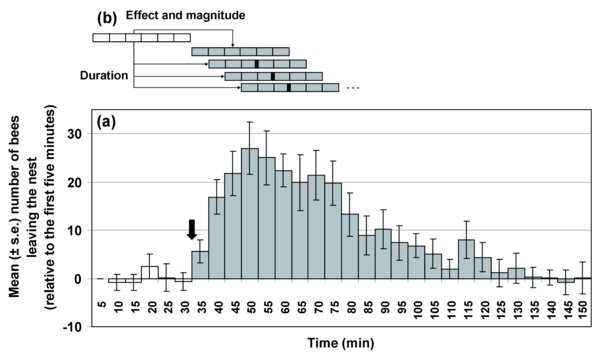
Effect of continuous exposure to the artificial recruitment pheromone on bumblebee traffic from the nest to the foraging arena for three colonies (colonies a–c). (a) Columns show mean (± 1 s.e., N = 8 trials) increase in traffic in each five minute interval relative to the traffic during the first five minutes interval. The arrow indicates when the pheromone vial was introduced inside the nest. White columns represent periods with no pheromone whereas grey columns represent periods during which a pheromone vial was suspended above the nest. (b) Only trials in which the first 30 minutes of testing showed significantly higher levels of traffic (based on t-tests) than during the 30 minute control phase were used, and these two values were used to compute the magnitude of the pheromone effect (which ranged from 1.5 to 3.6). Moving t-tests comparing the six intervals in the control phase to six contiguous five-minute test intervals were performed to determine the duration of the pheromone effect, which was defined as the central value of the moving sections (thick lines in the diagram). The maximum pheromone effect duration was 105 minutes, and the minimum was 40 minutes.