Figure 2
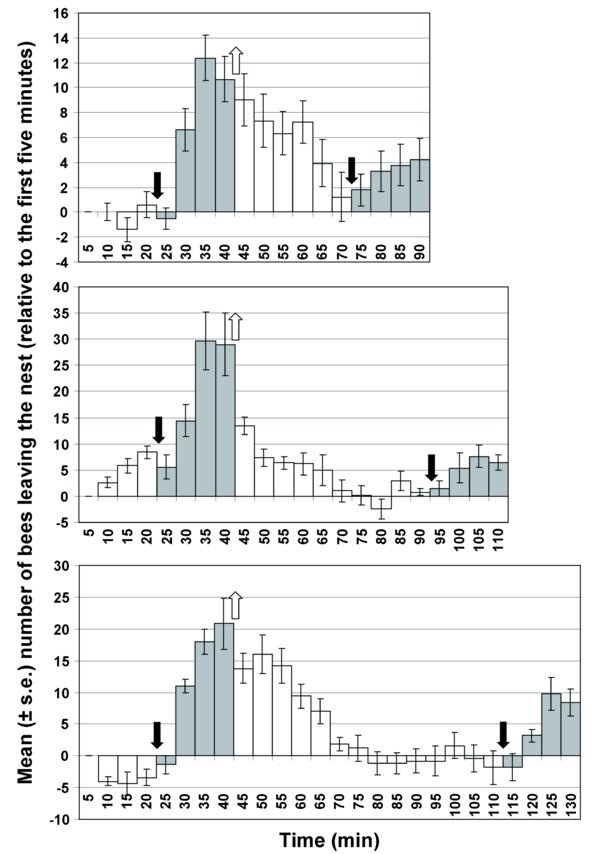
Effect of two brief daily exposures to the artificial recruitment pheromone on bumblebee traffic from the nest to the foraging arena, depending on the gap between exposures (top: 30 min, N = 18; middle: 50 min, N = 5; bottom: 70 min, N = 5) in a second set of three colonies (colonies d–f; the data for the three colonies are pooled). Columns show mean (±1 s.e.) increase in traffic levels for each five minute interval relative to the activity during the first five minute interval. The black arrows indicate when the pheromone vial was introduced inside the nest and the white arrow indicates when it was taken out of the nest. White columns represent periods with no pheromone whereas grey columns represent periods during which the pheromone vial was suspended above the nest. The introduction of the pheromone vial triggers a large increase in traffic. Its removal leads to a gradual decrease in bee activity level. The magnitude of the response to the second exposure is lower than the first.