Figure 2
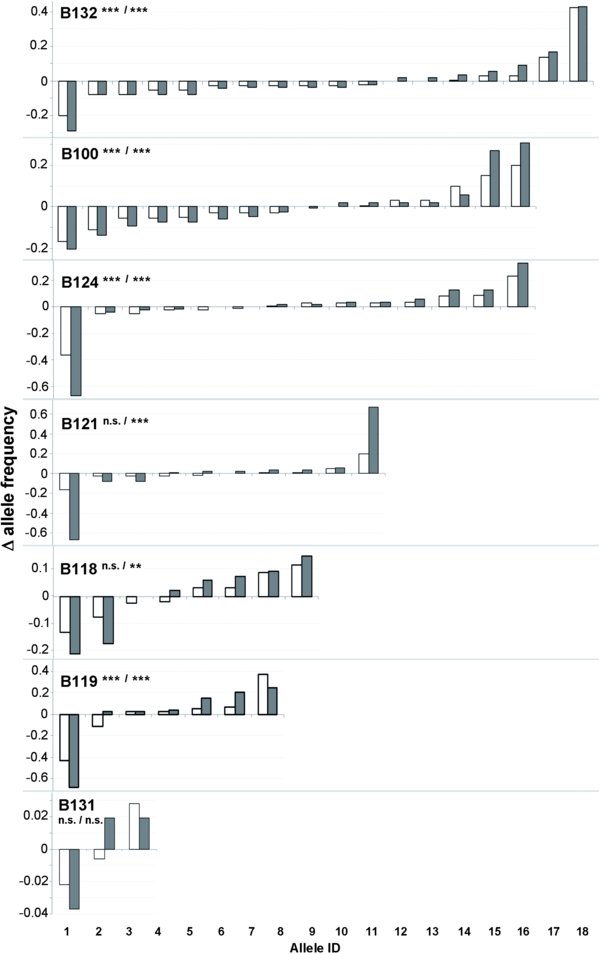
Difference between the allele frequencies (Δ allele frequency) of the B. terrestris and B. lucorum populations derived from morphology (white) and mtDNA RFLP (grey) groupings. The alleles are coded with a number and sorted in ascending order for the difference allele frequency. Morphology-derived populations differed significantly in the allele distribution (population wide frequency) in four out of seven loci (first significance indicators: ***/ = P < 0.001, **/ = P < 0.01), whereas populations from the mtDNA grouping differed significantly at six of seven loci (second significance indicators /*** = P < 0.001, /** = P < 0.01).