Free Access
Figure 4
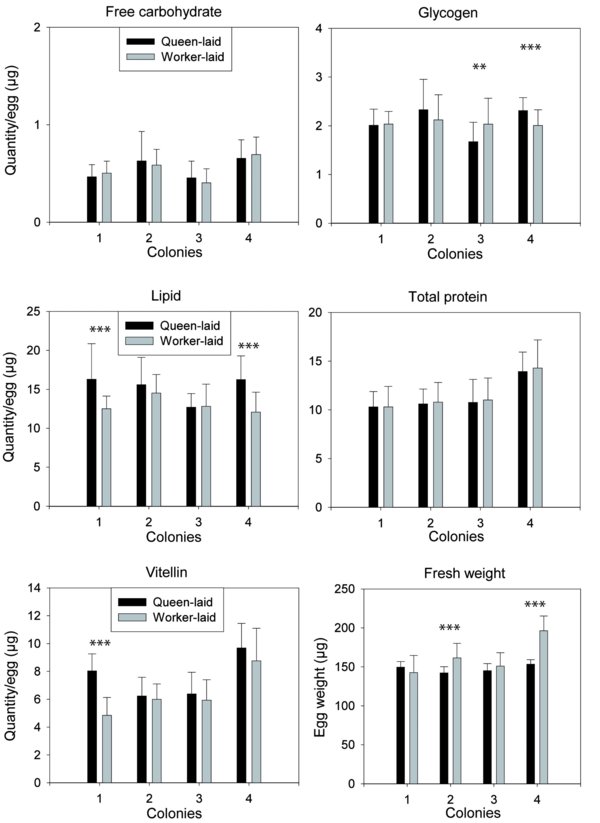
Weight of and quantities of nutrients contained in queen- and worker-laid eggs. Each bar represents the mean of 28–30 eggs ± standard deviation. ** Means significantly different (P < 0.01). *** Means significantly different (P < 0.001).