Free Access
Figure 4
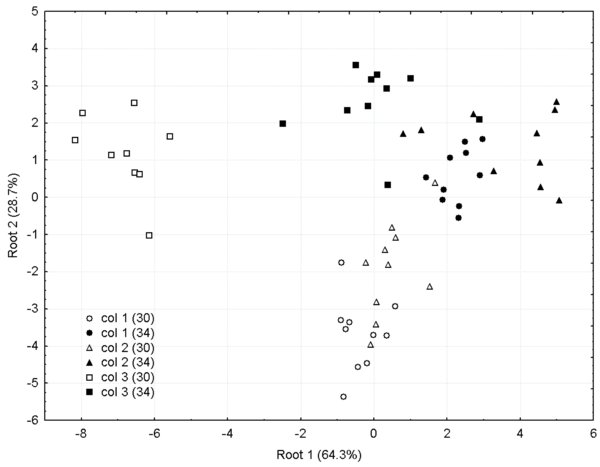
Plot of the first two roots of the discriminant analysis based on the surface hydrocarbons from the three colonies of bees with temperature treatments 34 °C and 30 °C (n = 10 per treatment per colony). The hydrocarbon profiles of bees from the two temperature treatments show a significant separation both when the colony of origin is included in the analysis (Wilks’ Lambda: 0.0049, F [ 45,204 ] = 10.377, P < 0.0001) and when the analysis is based only on two groups, i.e. 34 °C and 30 °C reared bees (Wilks’ Lambda: 0.1669, F [9,49] = 27.171, P < 0001).