Free Access
Figure 1
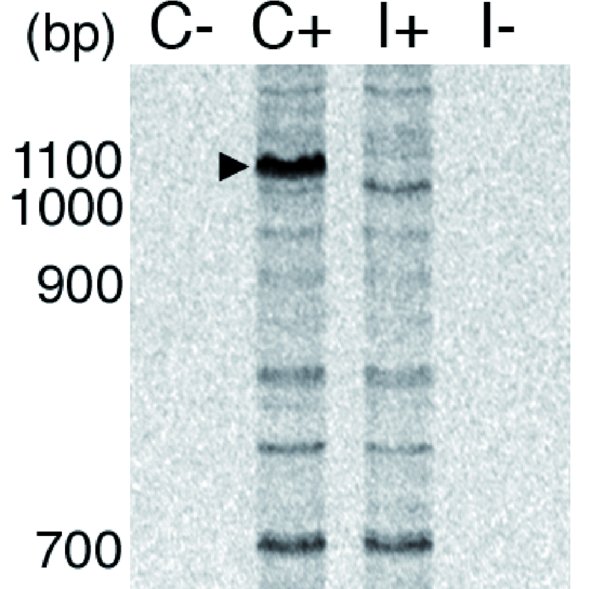
An electrophoresis profile of the fluorescent differential display comparing gene expression in the mushroom bodies of colony bees (C+) and isolated bees (I+). Numbers indicate molecular size (bp). Arrowhead indicates approximately 1.1-kbp band of the colony bee-specific gene. No bands were detected in the negative (RT-) control lanes (C- and I-).