Free Access
Figure 3
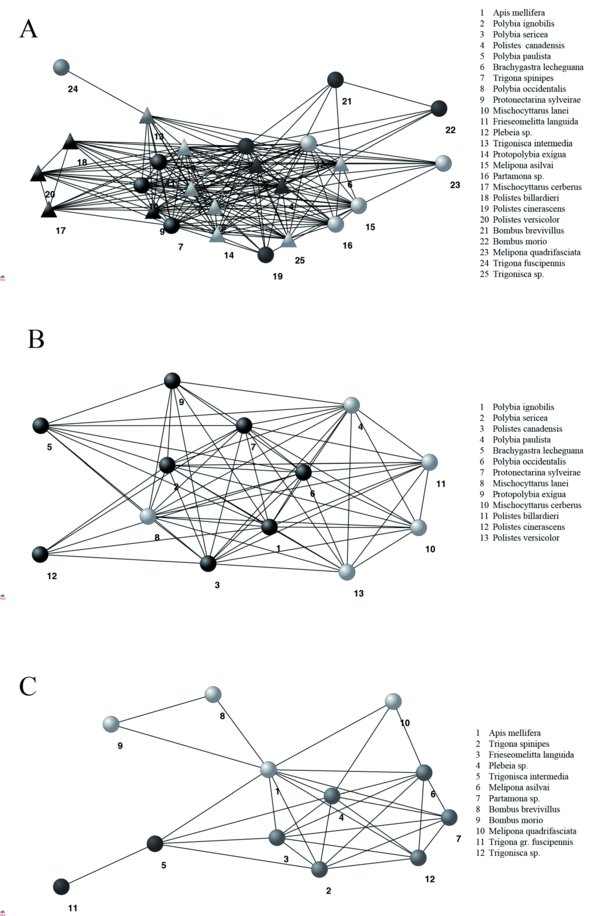
Graphs representing the modular structure (subgroups) of (A) the whole network, (B) the wasp-plant network and (C) the bee-plant network. All graphs are one-mode projections of their original networks and comprise only animal species (bees, wasps or both). Grey tones represent different modules identified in the analysis. In graph A, wasps are represented as triangles, and bees as ellipses.