| Issue |
Apidologie
Volume 41, Number 4, July-August 2010
|
|
|---|---|---|
| Page(s) | 451 - 453 | |
| DOI | https://doi.org/10.1051/apido/2009077 | |
| Published online | 08 January 2010 | |
Online material
 |
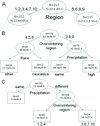
Figure 2 Recursive partitioning analysis of colony losses. A. The first node divides high and typical losses by region (1-10) where bees were kept. B. The high loss regions are split into very high and high loss groups based on overwintering area. The high loss group could further be divided based on bee race reported to be used by beekeepers. The very high loss group is further divided in two, and the highest losses occurred in areas with winter precipitation different than usual. C. The colonies at low loss regions also were affected by change in precipitation and overwintering region. The ovals indicate groups that could be further divided. Boxes indicate end of node. Analysis was stopped after 3 layers of partitioning or when one group would have included 6 5 records (see Segal, ). The first line is the number of records, the second line is average percent loss ± SD. The total records included in this analysis is lower than 288 because of missing items on 21 questionnaires. |
References see PDF file (Access here)
© INRA/DIB-AGIB/EDP Sciences, 2009


