| Issue |
Apidologie
Volume 41, Number 1, January-February 2010
|
|
|---|---|---|
| Page(s) | 62 - 72 | |
| DOI | https://doi.org/10.1051/apido/2009055 | |
| Published online | 14 October 2009 | |
Original article
The importance of protein type and protein to carbohydrate ratio for survival and ovarian activation of caged honeybees (Apis mellifera scutellata)*
L’importance du type de protéine et du rapport protéine-carbohydrate pour la survie et l’activité ovarienne chez des abeilles confinées (Apis mellifera scutellata)
Zur Bedeutung der Proteinquelle und des Protein/Kohlehydrat-Verhältnisses für das Überleben und die Ovaraktivität gekäfigter Honigbienen (Apis mellifera scutellata)
Department of Zoology and Entomology, University of Pretoria,
Pretoria
0002, South
Africa
Corresponding author: C.W.W. Pirk, This email address is being protected from spambots. You need JavaScript enabled to view it.
Received:
26
February
2009
Revised:
27
May
2009
Accepted:
28
May
2009
Abstract
Pollen is the natural source of protein for bees and it is commonly assumed that a high protein content in pollen is beneficial. Investigation of the optimal nutrient ratio for honeybees was prompted by our earlier study showing surprisingly high mortality in caged honeybees fed with the protein-rich pollen of Aloe greatheadii var davyana, although field bees experience optimal growth when feeding on this pollen. We tested the effect of different protein sources and different protein:carbohydrate (P:C) ratios on the survival and ovarian activation of caged bees. Bees fed casein showed consistently higher survival than those fed royal jelly or aloe pollen, regardless of P:C ratios. They survived longer on lower P:C ratios and longest on a pure carbohydrate diet. The greatest ovarian activation was recorded for bees fed royal jelly in a 1:3 P:C ratio, showing the superior quality of royal jelly for supporting development.
Zusammenfassung
Die Hauptnahrungsquellen für Honigbienen sind Nektar, der ihnenn hauptsächlich als Kohlenhydratquelle zur Energiegewinnung dient, und Pollen, der die hauptsächliche Proteinquelle darstellt und aus dem sie ausserdem Vitamine, Mineralien und Lipide gewinnen. Proteine sind vor allem für das rasche Wachstum der Larven und den Abschluss der Entwicklung erforderlich, und junge Arbeiterinnen füttern demzufolge die Larven mit Gelée royal, eingelagertem Pollen und Honig. Trotzdem sind unsere Kenntnisse gering über die Beziehungen der Makronährstoffe in der Diet der Honigbienen und deren physiologische Effekte. Wir untersuchten hier die Hypothese, ob eine Verringerung des Protein/Kohlenhydrat-Verhältnisses (P:C-Verhältnis), z.B. bedingt durch eine relative Anreicherung der Nahrung mit Kohlenhydraten, die Überlebensrate und die Ovaraktivität junger Arbeiterinnen erhöhen könnte. Dazu hielten wir jeweils 100 Arbeiteinnen in Käfigen in einem Brutschrank unter kontrollierten Bedingungen. Wir verabreichten ihnen jeweils eine von 11 zu testenden Diäten und untersuchten über einen Zeitraum von 14 Tagen die Überlebensraten. Danach wurden alle Bienen zur Erfassung der Ovarentwicklung abgetötet. Die Wichtigkeit des Kohlenhydratgehalts für das Überleben der Bienen ist unabhängig vom verabreichten Proteintyp (Abb. 1). Bienen, die auschschliesslich Proteine erhielten, zeigten eine deutlich verkürzte Lebensdauer, ganz im Gegensatz zu solchen, die ausschlieslich Sacharose erhielten. Der Unterschied zwischen diesen beiden Kontrolldiäten ist hochsignifikant (Tab. II). Innerhalb der Bienen, die den 14-täigen Untersuchungszeitraum überlebten. zeigten diejenigen, die Gelée royale in einen 1:3 P:C-Verhältnis erhalten hatten, den höchsten Grad der Ovaraktivierung (Abb. 2), mit einem mittleren Wert von Grad 3. Innerhalb der drei getesteten Proteinquellen zeigte Casein die besten Werte in Bezug auf die Überlebensraten, und zwar bei allen jeweiligen P:C-Verhältnissen. Da Gelée royale für alle essentiellen Aminosäuren über den Minimalanforderungen liegt und da Casein diese Anforderungen ebenfalls erfüllt, ist es unwahrscheinlich, dass die Aminosäurenzusammensetzung die niedrigere Mortalität bei Caseindiäten erklären kann. Die niedrigsten Überlebensraten hatten wir für Pollen von A. greatheadii var davyana, der von Bienen gesammelt war. Dies mag daran liegen, dass sich bei den gekäfigten Bienen nicht abbaubare und/oder toxische Substsanzen im Darm ansammeln.
Unsere Ergebnisse stehen in Einklang mit denen von Human et al. (2007), denenzufolge gekäfigte Bienen, die mit Aloepollen gefüttert worden waren, eine höhere Mortalität und eine geringere Ovaraktivität zeigten als Bienen, die Sonnenblumenpollen erhalten hatten. Dies könnte auf soziale Interaktionen innerhalb der gekäfigten Bienen zurückzuführen sein. Dominante Arbeiterinnen, die ihre Ovarien aktivieren, nutzen den “sozialen Nahrungsweg” und werden von untergeordneten Arbeiterinnen gefüttert, die Pollen verdauen und Gelée royale synthetisieren. Wenn diese untergeordneten Arbeiterinnen beispielsweise zu schnell aufgund der negativen Effekte von Pollen sterben, bricht die Nahrungskette zusammen und führt im Gesamtbild zu niedrigeren Überlebens- und Ovaraktivierungsraten. In einer Feldsituation hingegen kann vermutlich der Proteinüberschuss in A. greatheadii var davyana Pollen gegenüber anderen Nahrungskompenenten durch das Vorhandensein ausreichenden Nektars verdünnt werden. Ausserdem sind unter Feldbedingungen stets genügend Arbeiterinnen vorhanden, um eventuelle Ausfälle in der Kette des “sozialen Nahrungswegs” zu kompensieren.
Key words: Aloe / macronutrients / pollen / casein / royal jelly
Mots clés : Aloès / macronutriments / pollen / caséine / gelée royale
Schlüsselwörter: Aloe / Makronahrungsbestandteile / Pollen / Casein / Gelée royale
Manuscript editor: Klaus Hartfelder
© INRA/DIB-AGIB/EDP Sciences, 2010
1. INTRODUCTION
Honeybees obtain nutrients from nectar, which serves mainly as a source of carbohydrates supplying them with energy, and pollen, which in addition to supplying them with vitamins, minerals, and lipids is also their principal source of protein (Haydak, 1970). Protein sustains the rapid growth of larvae and the completion of development within the first few days after adult emergence (Crailsheim et al., 1992; Pernal and Currie, 2000). Larvae are fed protein-rich jelly, secreted by the fully developed hypopharyngeal glands of adult nurse bees (Hanser and Rembold, 1964; Rembold, 1974); older worker larvae in addition receive pollen and honey. Newly emerged bees are also fed jelly and utilize this protein source to develop their own hypopharyngeal glands; as nurse bees they begin to feed larvae and newly emerged adults when they are around six to eight days old (Rösch, 1925, 1927, 1930; Lindauer, 1952; Crailsheim, , 1991). In addition to jelly, young adult bees feed on stored pollen and honey (Crailsheim, ). Various studies have demonstrated the nutritional benefits of high protein levels in pollen. Kleinschmidt and Kondos (1976) concluded that a mimimum level of 20% crude protein (dry mass) in pollen was required for brood rearing in honeybees, and Herbert et al. (1977) measured optimum levels of 23–30% protein for brood rearing. When Schmidt et al. (1987) fed 25 different pollens to newly emerged adult bees, survival over an 80 day period was directly related to the protein content of the pollen provided for the first 20 days and to the total amount of protein consumed. Higher protein levels in both larval and adult diets lead to increased ovarian activation in honeybees (Hoover et al., 2006). The effectiveness of protein diets can also be evaluated by measuring protein levels in the hypopharyngeal glands and haemolymph of honeybees (Cremonez et al., 1998; Pernal and Currie, 2000; Malone et al., 2004).
In South Africa, Aloe greatheadii var davyana is an important indigenous bee plant in the winter dry season of the northern regions, and one reason for its value in building up colonies may be the high protein content of its pollen (Human and Nicolson, 2006). Honeybees (Apis mellifera scutellata) maintained on the aloe fields show higher ovarian activation than those on sunflower (Helianthus annuus) fields (Human et al., 2007). However, caged bees fed aloe pollen show lower survival and ovarian activation than those fed sunflower pollen (Human et al., 2007). This is surprising in view of the fact that bee-collected aloe and sunflower pollens have crude protein contents of 31 and 15% dry mass respectively (Pernal and Currie, 2000; Human and Nicolson, 2006). Amino acid composition may define the nutritional value of pollen more accurately than the crude protein content (De Groot, 1953). The levels of essential amino acids in aloe pollen are similar to those in royal jelly, only tryptophan not meeting the minimum requirements for honeybees (Human and Nicolson, 2006).
These conflicting observations with aloe and sunflower pollens might be related to differences in protein to carbohydrate (P:C) ratio in the diets of the bees. Insects maintained under laboratory conditions generally have fewer dietary options than those in the field. Nutritional imbalances in the diet mean that insects must increase their intake in order to meet their requirements for the deficient nutrients. In so doing, they ingest excess amounts of other nutrients, which may result in fitness costs, as many animals have a limited capacity to cope with nutrient excesses (Raubenheimer and Simpson, 1999). For example, excess protein ingested by honeybees has been reported to have detrimental effects, as it causes undigested material to accumulate in the gut (Maurizio, 1950; De Groot, 1953).
Little is known of the interaction between macronutrients in the diet of honeybees. In this study we tested the hypothesis that survival of young worker bees will increase as the P:C ratio decreases, i.e. as the proportion of carbohydrate in the diet increases. Workers of queenright colonies of A. mellifera scutellata show a high degree of ovarian activation when maintained on A. greatheadii var davyana (Kryger et al., 2000). We therefore expected that ovarian activation would increase with an increasing P:C ratio, because of the protein requirement for this process (De Groot, 1953). Moreover, confining bees in brood-free cages means that food consumption is directly related to the needs of the workers and provides a model system to study the effect of dietary protein on ovarian activation and survival.
2. MATERIALS AND METHODS
2.1. Bees and experimental cages
Frames of A. mellifera scutellata capped brood were collected from three different colonies in Magaliesburg (Gauteng, South Africa) in June 2007 and incubated overnight at 34 °C to obtain newly emerged adult worker bees. These honeybees, collected within 24 h of emergence, were introduced into cages in groups of 100. Queen breeding is not carried out in this area so the queens are unrelated. Cages contained individuals of a single colony.
Standard hoarding cages consisted of a rectangular wooden frame (11 × 8.5 × 7 cm) with movable glass slides at both front and back. The bottom of the cage was closed with wire mesh to allow ventilation. Below the glass slide at the front of each cage, a plastic frame was placed with round windows through which stoppered feeding tubes were inserted horizontally into the cages. These were plastic tubes with windows (2 × 1 cm) cut into them for the bees to access food. A piece of comb was attached to the top of each cage for the bees to cluster on. All cages were kept for 14 days under standard conditions in an incubator at 34 °C, 55% RH and no light to resemble colony conditions.
2.2. Experimental design
We simultaneously tested the effect of three different protein sources as well as five different protein to carbohydrate (P:C) ratios. The protein sources were bee-collected Aloe greatheadii var davyana pollen (hereafter referred to as aloe pollen), freeze-dried royal jelly and commercial casein powder (vitamin free, C 3400, Sigma-Aldrich®, Germany). The five P:C ratios tested were 0:1, 1:3, 1:1, 3:1 and 1:0. The three protein sources were incorporated into three different ratios (1:3, 1:1 and 3:1), while casein was used for the 1:0 ratio and sucrose for the 0:1 ratio, making 11 diets in total. The experiment required 33 cages (11 diets × 3 colonies).
For each of the 11 diets, 2 g of diet was mixed into a homogeneous paste by the addition of 1–2 mL water, and fed to each of three cages originating from a different colony. Diets were replaced with a fresh mixture daily and water was provided ad libitum. On day 2 tubes were dried and weighed after removal, in order to confirm that bees were consuming the different diets and that sufficient food was provided. Dead bees from each cage were removed and counted on a daily basis. On day 14, the conclusion of the experimental trials, dead bees were removed and counted as usual, and the surviving bees were killed by freezing at –20 °C and stored until dissection.
2.3. Diet preparation
Both pollen and royal jelly are natural sources of protein in the bees’ diet but both also contain carbohydrate. Bee-collected pollen of A. greatheadii var davyana contains 31.4% crude protein and 59.5% carbohydrate on a dry mass basis (Human and Nicolson, 2006). The increased carbohydrate content of bee-collected pollen compared to fresh pollen is due to addition of nectar during collection by bees (Human and Nicolson, 2006). Royal jelly contains approximately equal amounts of protein and carbohydrates (37.9% protein: 33.3% carbohydrate on a dry mass basis, calculated from Johannsmeier, 2001). It was therefore necessary to mix pollen and royal jelly with differing amounts of sucrose (pure carbohydrate) or casein (pure protein) in order to obtain the ratios (Tab. I). All three protein sources contained some moisture, so were dried for at least 24 h at 45 °C before mixing. In this study we concentrate on the effects of protein and carbohydrate to investigate the potential interaction between these two macronutrients. Nevertheless, the aloe pollen and royal jelly also contain other nutrients, such as pectin in pollen and lipids in both, which might play a role.
Preparation of diets. The mass (g) of each constituent per g food is given for each protein source and each P:C (protein to carbohydrate) ratio. Diet composition was calculated based on literature data on protein and carbohydrate levels in pollen and royal jelly (see text).
The pollen used to feed bees was collected from hives placed in aloe fields at Roodeplaat Nature Reserve (Gauteng, South Africa) during the 2006 flowering season, and stored at –20 °C. Freezing and storage for up to one year has no effect on the nutritional value of pollen (Dietz and Haydak, 1965; Hagedorn, 1968), including its protein content (Pernal and Currie, 2000). The pollen was crushed mechanically by grinding it in a pestle and mortar before mixing with either casein or sucrose. Sucrose (Sigma-Aldrich®, Germany) was granular, and was also finely ground to a powder so that all components would mix homogeneously with other dietary components. Casein powder (Sigma-Aldrich®, Germany) and freeze-dried royal jelly (True Blue Health Products®, Australia) were already in a finely powdered form.
2.4. Ovarian dissection
Ovaries were dissected from caged bees, derived from the three colonies, that were frozen on day 14, the conclusion of the experimental trials. Twenty bees were randomly selected from each of the treatments (if more than 20 survived). The abdomen of each bee was opened by pulling the sternites back, thereby exposing the ovaries which were examined using a binocular dissecting microscope. Their stage of activation was visually scored using a five-point scale, modified from Hess (1942): stage 1 is inactive thread-like ovarioles without vitellus; stage 2 is swollen ovarioles without vitellus; stage 3 is swollen ovarioles with visible vitellus but without distinct oocytes; in stage 4 the ovarioles contain distinct, but immature oocytes; and stage 5 is fully activated ovaries with distinct mature oocytes. The different stages of ovarian activation were categorised for statistical analysis as inactive (a, stage 1), intermediate (b, stage 2 & 3), and fully activated (c, stage 4 & 5).
2.5. Statistical analysis
Kaplan-Meier survival regression analyses were conducted for all diets with diet as the grouping variable. Gehan-Wilcoxon pair-wise tests were performed in order to determine significant differences between each of the 11 diets (significance set at P < 0.05 with Bonferroni adjustment) for each of the colonies separately. In order to evaluate differences in ovarian activation between the different protein and P:C ratio treatments, a Kruskal-Wallis ANOVA with post hoc tests (multiple comparisons of mean ranks for all groups) was performed, with diet as the grouping variable and stage of ovary activation as the dependent variable.
3. RESULTS
3.1. Survival
The importance of dietary carbohydrate for survival in honeybees, regardless of the type of protein source, is clearly shown in Figure 1. Bees fed pure protein showed significantly lower survival than those fed sucrose (Tab. II). Consumption of all diets was clearly visible, and on day 2, when we measured the remaining diet in the tubes to ensure that sufficient food was being supplied to the bees, consumption ranged from 0.15 g (casein 3:1) to 1.3 g (pure casein).
 |
Figure 1 Cumulative survival of worker bees, pooled for all colonies (n = 3) for reasons of clarity. Bees were fed pure casein, pure sucrose, and three protein sources (casein, aloe pollen and royal jelly) in three different protein:carbohydrate (P:C) ratios of 3:1, 1:1, and 1:3. The three protein sources are compared in A (casein), B (pollen) and C (royal jelly). |
Comparison of survival of different groups fed on one of eleven diets, using Gehan-Wilcoxon pairwise comparisons separately for each colony. A greater sign means that the survival of the group in the row is significantly longer compared to the group in the column for that particular colony (* < 0.05; ** < 0.01; *** < 0.001).
Of the bees fed casein, survival of those fed a 1:3 P:C ratio did not differ significantly from survival of those fed a 1:1 P:C ratio (Fig. 1A, Tab. II). However there was a highly significant difference between those bees fed casein in a 3:1 P:C ratio and those fed casein in a P:C ratio of either 1:1 or 1:3 (Tab. II). Among bees fed a 3:1 P:C ratio, 50% died by day 10 of the trial and less than 20% survived the complete 14 day trial. In contrast, at least 80% of the bees fed casein in the other two ratios (1:3 and 1:1) survived the complete trial (Fig. 1A) which was not significantly different compared to the pure sucrose diet.
Survival of bees fed pollen was significantly reduced on a 1:1 P:C ratio compared to a 1:3 ratio for colonies 1 and 3 but not colony 2. Survival of workers was significantly higher on the 1:1 ratio compared to the 3:1 ratio for colony 1, but the opposite was the case for colony 3 (Tab. II). However, bees from colony 2 did significantly worse on the 3:1 ratio compared to 1:3 but not when compared to the 1:1 ratio (Tab. II). For colonies 1 and 3 there was no significant difference between the 3:1 and 1:3 ratios. None of the bees fed the pollen treatments survived the full trial period: all bees were dead by day 11 at the latest, with a very high mortality between days 2 and 6 (Fig. 1B). Moreover, survival was significantly higher on diets with casein compared to those with pollen diet for the all ratios except for colony 2 when comparing casein 3:1 with pollen 1:3 (Fig. 1, Tab. II). The survival was significantly higher on the pure sucrose diet compared to the pollen ones and they performed significantly better on pure casein compared to the 3:1 or 1:1 pollen diet (Tab. II).
All colonies fed royal jelly in different P:C ratios showed significantly increased survival with increasing carbohydrate content (Fig. 1C). Only for colony 2 was the difference between the 3:1 and 1:1 ratio not significant (Tab. II). All three P:C diets differed significantly from the pure sucrose diet (Tab. II). Two of the colonies (1 and 2) showed significantly higher survival on the pure casein than on the royal jelly 3:1 and colonies 2 and 3 performed significantly better when compared to the royal jelly 1:1 ratio. Nevertheless, all workers died by day 5 when fed royal jelly 3:1 or 1:1 ratios or pure casein. All colonies showed lower survival on the pure casein diet compared to the royal jelly 1:3 ratio with 10% surviving when fed the latter diet.
When comparing protein sources, bees fed casein experienced significantly higher survival than those fed the same ratio with the other two protein treatments (Fig. 1; Tab. II). The picture is less simple when comparing pollen and royal jelly in a 3:1 ratio; colony 1 performed significantly better on the pollen diet, whereas the opposite was true for colonies 2 and 3. Of those bees fed a 1:1 P:C ratio, colonies 2 and 3 lived for a significantly shorter time on the pollen diet than on the royal jelly one, whereas the opposite was true for colony 1. However, when fed a P:C ratio of 1:3, bees fed royal jelly did significantly better than those fed pollen. The results show that there is an interaction between survival and P:C ratio as well as with protein source: the ratios had different effects depending on the protein source used. The Spearmans rank correlation also showed a significantly negative correlation between P:C ratio and survival (n = 278, R = − 0.21, P < 0.05) indicating that a higher protein content results in a lower survival.
3.2. Ovarian activation
In bees that survived the 14 day trial, ovarian activation was greatest in those fed royal jelly in a 1:3 P:C ratio, with a mean level of activation of 3.0 ± 1.1 (Fig. 2). There was a highly significant difference between this and all other diets, except for bees fed the casein 1:1 P:C treatment. There was also a significant difference between bees fed pure sucrose and any other treatment, with sucrose-fed bees displaying the lowest level of ovarian activation (mean = 1.1 ± 0.3). Among bees fed casein, those on the 1:1 P:C diet (mean = 2.0 ± 0) had significantly higher ovarian activation than those on the 3:1 ratio (mean = 1.5 ± 0.5; Kruskal-Wallis test: H (4, n = 225) = 125.93, P < 0.05) (Fig. 2). There was no difference in the level of activation between bees fed the casein 1:1 and 1:3 P:C (mean = 1.7 ± 0.5) ratios.
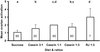 |
Figure 2 Ovarian activation of surviving bees from 3 colonies on day 14. Data are for bees fed sucrose, casein in the protein:carbohydrate (P:C) ratios 3:1, 1:1, and 1:3, and royal jelly in a 1:3 ratio. On the remaining diets (see Fig. 1) none of the bees survived for 14 days. Ovarian activation score is given as mean ± SD (n in bar = number of bees; for casein 1:1 SD = 0). Different letters denote significant differences at the P < 0.05 level based on multiple comparison of mean ranks for all groups. |
4. DISCUSSION
Pollen is the natural source of protein for bees and is essential not only during the larval stages but also for gland and ovarian activation. In spite of this, the survival of young worker honeybees was negatively correlated with the protein level in their diet. On all three protein sources, we observed an increase in survival with a decrease in protein to carbohydrate (P:C) ratio. The pollen diet showed the highest variability among the colonies. The protein content of pollen varies widely and is generally accepted as a measure of its nutritional value for bees (Pernal and Currie, 2000; Roulston et al., 2000; Somerville and Nicol, 2006; Mapalad et al., 2008). However, Roulston et al. (2000) found no evidence that bees prefer to collect pollens of high protein content. Pernal and Currie (2001) showed that increased protein demands of honeybee colonies appear to be met by increasing the rate of pollen collection rather than by collecting pollen of higher protein content. They found that the development of hypopharyngeal glands and ovaries was more strongly correlated with the amount of the proteins ingested (quantity) than with the protein content of diets (quality, Pernal and Currie, 2001). Schmidt et al. (1987) demonstrated that Populus pollen, in spite of its low protein content, increased honeybee survival more than other pollens with higher protein contents.
Of the three protein sources tested, casein was most beneficial to the bees with respect to survival. This nutritional advantage was observed on all P:C ratios. Casein is not part of the natural diet of honeybees but this purified protein powder is commonly used in nutritional studies on a variety of animals. The nutritional value of a protein source depends on its amino acid composition. When caterpillars of Spodoptera littoralis were fed diets containing casein and zein (a poor quality plant protein), Lee (2007) found that the effect of protein quality was more strongly expressed at lower P:C ratios. The amino acid requirements of honeybees were identified by De Groot (1953), who showed that royal jelly exceeds the minimum requirements for all essential amino acids. Casein also meets these requirements (Weaver and Kuiken, 1951), so it is unlikely that amino acid composition can explain the lower bee mortality observed on casein diets. Pollen of A. greatheadii var davyana exceeds the minimum requirements of honeybees for all essential amino acids except tryptophan (Human and Nicolson, 2006). A more serious amino acid deficiency is that of isoleucine, which was identified as one of the most important amino acids by De Groot (1953), but is limiting in many Australian pollens, especially those of eucalypts (Somerville and Nicol, 2006). It seems unlikely that the amino acid composition is the sole explanation for the significant differences in honeybee survival on the three different protein sources in this study.
The lowest survival was observed with bee-collected pollen of A. greatheadii var davyana. Increased mortality and reduced ovarian activation were previously seen in caged bees provided with aloe pollen, compared to sunflower pollen, whereas under field conditions aloe pollen promoted higher ovarian activation (Human et al., 2007). Worker bees feeding on aloe pollen in the field are able to adjust their intake of pollen and nectar and hence can dilute the high protein levels of pollen. These bees are also able to fly out of the nest and defecate regularly, hence preventing a potential build up of toxins in their gut compared to bees kept in cages. Furthermore, the amount of carbohydrate available to caged bees in our experiment was less on pollen diets than on casein or royal jelly diets, because some of the carbohydrate in pollen consists of indigestible cell wall components (Bell et al., 1983), even though extraction of the cytoplasm of A. greatheadii var davyana pollen by honeybees is very efficient (Human et al., 2007) and the additional grinding of the pollen served to ensure utilisation of the carbohydrates.
Nurse bees transform relatively indigestible pollen into protein-rich jelly for the feeding of larvae and other adult bees (Crailsheim, 1991). Like aloe pollen, royal jelly also yielded lower survival in the caged bees than casein in the same P:C ratios. Similarly, Lin and Winston (1998) found that increasing the concentration of royal jelly increased the mortality of caged bees, and a diet of pure royal jelly caused 100% mortality in three days. The P:C ratio in royal jelly is close to 1:1 (Johannsmeier, 2001; Wongchai and Ratanavalachai, 2002), and the high protein levels might have an adverse effect on survival.
Ovarian activation was highest in bees fed royal jelly, and it was higher in bees fed casein in the 1:1 ratio than in those fed pure sucrose. However, the casein 1:1 diet did not differ significantly from the bees fed royal jelly in a 1:3 ratio. The royal jelly treatment was most likely more suitable for promoting ovarian activation in bees because of the presence of other nutrients (Wirtz and Beetsma, 1972), which are absent in the casein treatments. Lin and Winston (1998) compared ovarian activation in caged bees after 14 days on a honey diet and on diets in which pollen or royal jelly were added to the honey. Their pollen-fed bees survived long enough for ovarian activation to be measured, although the level of activation was less than on royal jelly diets, a difference that Lin and Winston (1998) attributed to the incomplete digestion of pollen protein.
The relative proportions of protein and digestible carbohydrate for optimal performance differ between insects (Simpson and Raubenheimer, 1993). Nutritional studies on locusts and caterpillars have demonstrated optimal P:C ratios close to 1:1 (Raubenheimer and Simpson, 1993; Lee et al., 2002). In other insects the ideal ratio is more biased towards carbohydrates. First instar pea aphids perform best on a diet with an amino acid:sucrose ratio of 1:19 mg/mg (Abisgold et al., 1994), showing a strong bias towards carbohydrate, and confirming the prediction of Simpson and Raubenheimer (1993) that insects with mycetocyte symbionts would have lower P:C ratios than those without. In a recent study of ants (Rhytidoponera metallica), the optimal P:C ratio for colony performance was 1:2, measured in terms of both worker mortality and the number of larvae raised (Dussutour and Simpson, 2008). Because of the commonly observed trade-off between reproduction and longevity, survival and reproduction are not expected to be comparable as performance measures for macronutrient regulation. In Drosophila melanogaster, longevity is greatest on a very low P:C ratio of 1:16, but the egg-laying rate of these insects is highest at a P:C ratio of 1:2 (Lee et al., 2008). Optimal P:C ratios for reproduction differ between the sexes in crickets, and both differ from the ideal ratio for maximal longevity (Maklakov et al., 2008). In our study, the performance variables of survival and ovarian activation indicate differences in optimal P:C ratios when the bees are given no choice of diet. In future studies the position of the intake target in honeybees should be estimated by allowing them to select among nutritionally complementary foods (Raubenheimer and Simpson, 1999).
Our results support the finding of Human et al. (2007) that caged honeybees fed bee-collected aloe pollen show higher mortality than seems to be the case in the field and also lower levels of ovarian activation. This may be attributed to the social interactions among caged bees. It has been shown that those workers becoming reproductively active under caged conditions consume little pollen, instead being fed by other workers (Schäfer et al., 2006). These dominant workers, which activate their ovaries, utilise the “social pathway” (Schäfer et al., 2006), and thereby rely on others to digest the pollen and synthesise jelly. If these subordinate workers die too quickly because of the detrimental effect of the pollen, the supply chain will collapse. Disruption of the “social pathway”, due to early death of the subordinates (suppliers), will then result in lower survival and lower ovarian activation. This does not apply to the field situation, where excess protein relative to other nutrients in the pollen of A. greatheadii var davyana can be diluted by abundant nectar carbohydrate. Furthermore, in field colonies ample workers are present to compensate for any deaths in the supply chain of the “social pathway”.
Acknowledgments
We thank Tinus de Klerk for providing bees, and Roodeplaat Nature Reserve for permission to place hives in the aloe fields. Financial support came from the National Research Foundation of South Africa, the University of Pretoria, and the Claude Leon foundation (CWWP).
References
- Abisgold J.D., Simpson S.J., and Douglas A.E. (1994) Nutrient regulation in the pea aphid Acyrthosiphon pisum: application of a novel geometric framework to sugar and amino acid consumption, Physiol. Entomol. 19, 95–102 [CrossRef] [Google Scholar]
- Bell R.R., Thornber E.J., Seet J.L.L., Groves M.T., Ho N.P., Bell D.T. (1983) Composition and protein quality of honeybee-collected pollen of Eucalyptus marginata and Eucalyptus calophylla, J. Nutr. 113, 2479–2484 [PubMed] [Google Scholar]
- Crailsheim K. (1990) The protein balance of the honey bee worker, Apidologie 21, 417–429 [CrossRef] [EDP Sciences] [Google Scholar]
- Crailsheim K. (1991) Interadult feeding of jelly in honeybee Apis mellifera L colonies, J. Comp. Physiol. B 161, 55–60 [CrossRef] [Google Scholar]
- Crailsheim K., Schneider L.H.W., Hrassnigg N., Bühlmann G., Brosch U., Gmeinbauer R., and Schoffmann B. (1992) Pollen consumption and utilization in worker honeybees (Apis mellifera carnica): dependence on individual age and function, J. Insect Physiol. 38, 409–419 [Google Scholar]
- Cremonez T.M., de Jong D., Bitondi M.M.G. (1998) Quantification of hemolymph proteins as a fast method for testing protein diets for honey bees (Hymenoptera: Apidae), J. Econ. Entomol. 91, 1284–1289 [Google Scholar]
- De Groot A.P. (1953) Protein and amino acid requirements of the honey bee, Physiol. Comp. Oecol. 3, 1–83 [Google Scholar]
- Dietz A., Haydak M.H. (1965) Causes of nutrient deficiency in stored pollen for development of newly emerged honey bees, Proc. Int. Jubilee Beekeeping 20th Congr. Bucharest, Apimondia Publ. House, Bucharest, pp. 238–241. [Google Scholar]
- Dussutour A., Simpson S.J. (2008) Description of a simple synthetic diet for studying nutritional responses in ants, Insect. Soc. 55, 329–333 [CrossRef] [Google Scholar]
- Hagedorn H.H. (1968) Effect of the age of pollen used in pollen supplements on their nutritive value for the honeybee. I. Effect on thoracic weight, development of hypopharyngeal glands and brood rearing, J. Apic. Res. 7, 89–95 [Google Scholar]
- Hanser G., Rembold H. (1964) Analytische und histologische Untersuchungen der Kopf- und Thoraxdrüsen bei der Honigbiene Apis mellifera, Z. Naturforsch. 19B, 938–943 [Google Scholar]
- Haydak M.H. (1970) Honey bee nutrition, Annu. Rev. Entomol. 15, 143–156 [CrossRef] [Google Scholar]
- Herbert E.W., Shimanuki H., Caron, D.M. (1977) Optimum protein levels required by honeybees (Hymenoptera, Apidae) to initiate and maintain brood rearing, Apidologie 8, 141–146 [CrossRef] [EDP Sciences] [Google Scholar]
- Hess G. (1942) Über den Einfluß der Weisellosigkeit und des Fruchtbarkeitsvitamins E auf die Ovarien der Bienenarbeiterin. Ein Beitrag zur Frage der Regulationen im Bienenstaat, Beih. Schweiz. Bienen Ztg. 2, 33–111 [Google Scholar]
- Hoover S.E.R., Higo H.A., Winston, M.L. (2006) Worker honey bee ovary development: seasonal variation and the influence of larval and adult nutrition, J. Comp. Physiol. B 176, 55–63 [CrossRef] [PubMed] [Google Scholar]
- Human H., and Nicolson S.W. (2006) Nutritional content of fresh, bee-collected and stored pollen of Aloe greatheadii var davyana (Asphodelaceae), Phytochemistry 67, 1486–1492 [CrossRef] [PubMed] [Google Scholar]
- Human H., Nicolson S.W., Strauss K., Pirk C.W.W., and Dietemann V. (2007) Influence of pollen quality on ovarian development in honeybees Apis mellifera scutellata, J. Insect Physiol. 53, 649–655 [CrossRef] [PubMed] [Google Scholar]
- Johannsmeier M.F. (2001) Beekeeping in South Africa, 3rd ed., Agricultural Research Council of South Africa, Pretoria, South Africa. [Google Scholar]
- Kleinschmidt G.J., and Kondos A.C. (1976) The influence of crude protein levels on colony production, Aust. Beekeep. 80, 251–257 [Google Scholar]
- Kryger P., Swart D., and Johannsmeier M. (2000) The Capensis problem and the aloe flow, S. Afr. Bee J. 72, 11–12 [Google Scholar]
- Lee K.P. (2007) The interactive effects of protein quality and macronutrient imbalance on nutrient balancing in an insect herbivore, J. Exp. Biol. 210, 3236–3244 [CrossRef] [PubMed] [Google Scholar]
- Lee K.P., Behmer S.T., Simpson S.J., and Raubenheimer D. (2002) A geometric analysis of nutrient regulation in the generalist caterpillar Spodoptera littoralis (Boisduval), J. Insect Physiol. 48, 655–665 [CrossRef] [PubMed] [Google Scholar]
- Lee K.P., Simpson S.J., Clissold F.J., Brooks R., Ballard J.W.O., Taylor P.W., Soran N., and Raubenheimer D. (2008) Lifespan and reproduction in Drosophila: new insights from nutritional geometry, Proc. Natl Acad. Sci. (USA) 105, 2498–2503 [CrossRef] [Google Scholar]
- Lin H., Winston M.L. (1998) The role of nutrition and temperature in the ovarian development of the worker honey bee Apis mellifera, Can. Entomol. 130, 883–891 [CrossRef] [Google Scholar]
- Lindauer M. (1952) Ein Beitrag zur Frage der Arbeitsteilung im Bienenstaat, Z. Vergl. Physiol. 34, 299–345 [CrossRef] [Google Scholar]
- Maklakov A.A., Simpson S.J., Zajitschek F., Hall M.D., Dessmann J., Clissold F., Raubenheimer D., Bonduriansky R., Brooks R.C. (2008) Sex-specific fitness effects of nutrient intake on reproduction and lifespan, Curr. Biol. 18, 1062–1066 [CrossRef] [PubMed] [Google Scholar]
- Malone L.A., Todd J.H., Burgess E.P.J., and Christeller J.T. (2004) Development of hypopharyngeal glands in adult honey bees fed with a Bt toxin, a biotin-binding protein and a protease inhibitor, Apidologie 35, 655–664 [CrossRef] [EDP Sciences] [Google Scholar]
- Mapalad K.S., Leu D., Nieh J.C. (2008) Bumble bees heat up for high quality pollen, J. Exp. Biol. 211, 2239–2242 [CrossRef] [PubMed] [Google Scholar]
- Maurizio A. (1950) The influence of pollen feeding and brood rearing on the length of life and physiological condition of the honeybee, Bee World 31, 9–12 [Google Scholar]
- Pernal S.F., and Currie R.W. (2000) Pollen quality of fresh and 1-year-old single pollen diets for worker honey bees (Apis mellifera L.), Apidologie 31, 387–409 [CrossRef] [EDP Sciences] [Google Scholar]
- Pernal S.F., and Currie R.W. (2001) The influence of pollen quality on foraging behavior in honeybees (Apis mellifera L.), Behav. Ecol. Sociobiol. 51, 53–68 [CrossRef] [Google Scholar]
- Raubenheimer D., Simpson S.J. (1993) The geometry of compensatory feeding in the locust, Anim. Behav. 45, 953–964 [CrossRef] [Google Scholar]
- Raubenheimer D., Simpson S.J. (1999) Integrating nutrition: a geometrical approach, Entomol. Exp. Appl. 91, 67–82 [CrossRef] [Google Scholar]
- Rembold H. (1974) Die Kastenbildung bei der Honigbiene, Apis mellifica L aus biochemischer Sicht, in: Schmidt G.H. (Ed.), Sozialpolymorphismus bei Insekten Wissenschaflliche Verlagsgesellschaft Stuttgart. [Google Scholar]
- Rösch G.A. (1925) Untersuchungen über die Arbeitsteilung im Bienenstaat. 1. Teil: Die Tätigkeiten im normalen Bienenstaate und ihre Beziehungen zum Alter der Arbeitsbienen, Z. Vergl. Physiol. 2, 571-631 [Google Scholar]
- Rösch G.A. (1927) Über die Bautätigkeit im Bienenvolk und das Alter der Baubienen. Weiterer Beitrag zur Frage nach der Arbeitsteilung im Bienenstaat, Z. Vergl. Physiol. 6, 264–298 [CrossRef] [Google Scholar]
- Rösch G.A. (1930) Untersuchungen über die Arbeitsteilung im Bienenstaat. 2. Teil: Die Tätigkeiten der Arbeitsbienen unter experimentell veränderten Bedingungen, Z. Vergl. Physiol. 12, 1–71 [CrossRef] [Google Scholar]
- Roulston T.H., Cane J.H., and Buchmann S.L. (2000) What governs protein content of pollen: pollinator preferences, pollen pistil interactions, or phylogeny? Ecol. Monogr. 70, 617–643 [Google Scholar]
- Schäfer M.O., Dietemann V., Pirk C.W.W., Neumann P., Crewe R.M., Hepburn H.R., Tautz J., and Crailsheim K. (2006) Individual versus social pathway to honeybee worker reproduction (Apis mellifera): pollen or jelly as protein source for oogenesis? J. Comp. Physiol. A 192, 761–768 [CrossRef] [Google Scholar]
- Schmidt J.O., Thoenes S.C., Levin M.D. (1987) Survival of honey bees, Apis mellifera (Hymenoptera: Apidae) fed various pollen sources, Ann. Entomol. Soc. Am. 80, 176–183 [Google Scholar]
- Simpson S.J., and Raubenheimer D. (1993) A multi-level analysis of feeding behaviour: the geometry of nutritional decisions, Philos. T. Roy. Soc. Lond. B 342, 381–402 [CrossRef] [Google Scholar]
- Somerville D.C., Nicol H.I. (2006) Crude protein and amino acid composition of honey bee-collected pollen pellets from south-east Australia and a note on laboratory disparity, Aust. J. Exp. Agr. 46, 141–149 [CrossRef] [Google Scholar]
- Weaver N., Kuiken K.A. (1951) Quantitative analysis of the essential amino acids of royal jelly and some pollens, J. Econ. Entomol. 44, 635–638 [Google Scholar]
- Wirtz P., Beetsma J. (1972) Induction of caste differentiation in the honeybee (Apis mellifera) by juvenile hormone, Entomol. Exp. Appl. 15, 517–520 [CrossRef] [Google Scholar]
- Wongchai V., and Ratanavalachai T. (2002) Seasonal variation of chemical composition of royal jelly produced in Thailand, Thammasat Int. J. Sci. Technol. 7, 1–8 [Google Scholar]
All Tables
Preparation of diets. The mass (g) of each constituent per g food is given for each protein source and each P:C (protein to carbohydrate) ratio. Diet composition was calculated based on literature data on protein and carbohydrate levels in pollen and royal jelly (see text).
Comparison of survival of different groups fed on one of eleven diets, using Gehan-Wilcoxon pairwise comparisons separately for each colony. A greater sign means that the survival of the group in the row is significantly longer compared to the group in the column for that particular colony (* < 0.05; ** < 0.01; *** < 0.001).
All Figures
|
Figure 1 Cumulative survival of worker bees, pooled for all colonies (n = 3) for reasons of clarity. Bees were fed pure casein, pure sucrose, and three protein sources (casein, aloe pollen and royal jelly) in three different protein:carbohydrate (P:C) ratios of 3:1, 1:1, and 1:3. The three protein sources are compared in A (casein), B (pollen) and C (royal jelly). |
| In the text | |
|
Figure 2 Ovarian activation of surviving bees from 3 colonies on day 14. Data are for bees fed sucrose, casein in the protein:carbohydrate (P:C) ratios 3:1, 1:1, and 1:3, and royal jelly in a 1:3 ratio. On the remaining diets (see Fig. 1) none of the bees survived for 14 days. Ovarian activation score is given as mean ± SD (n in bar = number of bees; for casein 1:1 SD = 0). Different letters denote significant differences at the P < 0.05 level based on multiple comparison of mean ranks for all groups. |
| In the text | |