Free Access
Figure 1
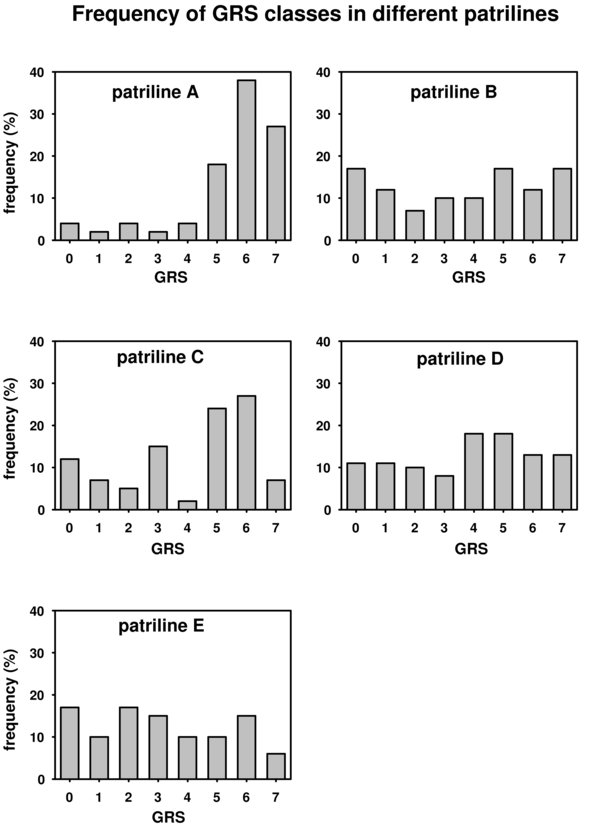
Distribution of gustatory response scores (GRS) for each patriline. The x-axis shows the GRS classes. The y-axis displays the relative frequency of bees in each patriline. Distributions of GRS differ significantly between patriline A and patriline E (for statistics see text). The numbers of bees tested in each patriline are as follows: A: 45, B: 42, C: 41, D: 63, E: 48.