Free Access
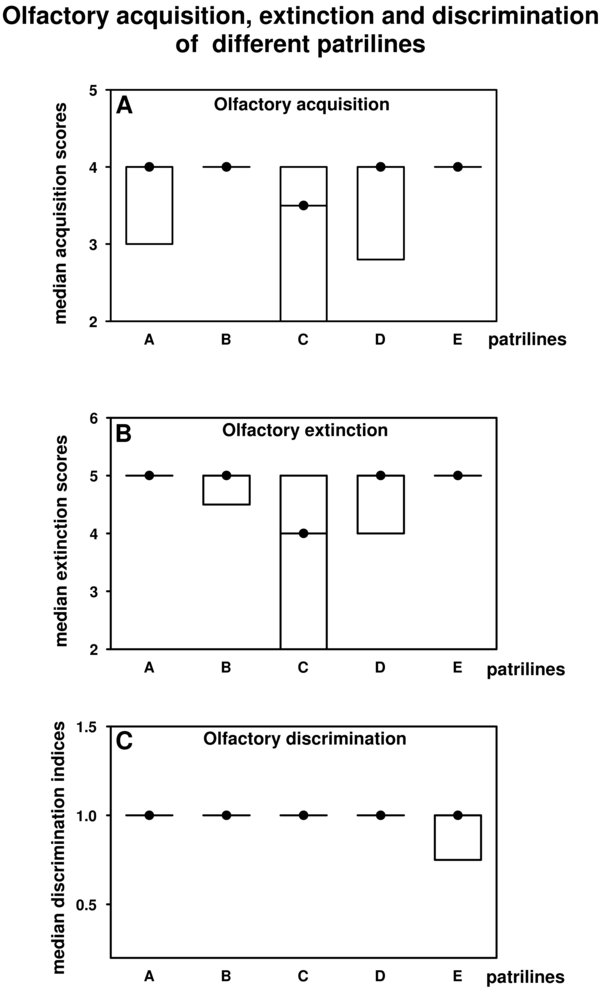
Figure 2

Median olfactory acquisition scores (A), median olfactory extinction scores (B), and median olfactory discrimination indices (C) and quartiles of conditioned bees in each patriline. Note that the bees of the different patrilines did not differ in their sucrose responsiveness. The x-axis displays the different patrilines. The y-axis shows the median scores (dots) and the quartiles (lower line = 25% quartile, upper line = 75% quartile). The numbers of bees in (A) are: A: 31, B: 18, C: 18, D: 26, E: 13. The numbers of bees in (B) and (C) are A: 28, B: 17, C: 17, D: 22, E: 12.


