Figure 1
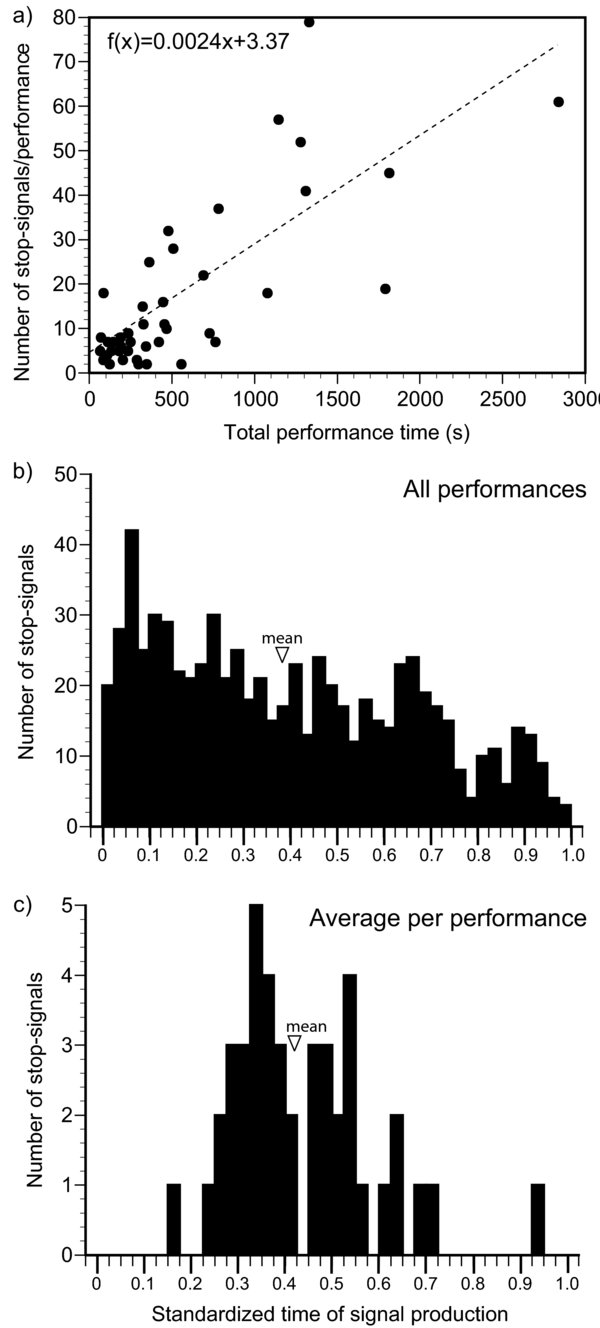
Temporal distribution of stop-signals (N = 43 bees, average performance length = 550.5 ± 579.3 s, total analysis time = 6.58 hrs). We show the standardized time of signal production, which is calculated as the time of signal production divided by total performance time (total time that a forager spent inside the nest after returning from the feeder). (a) Number of signals vs. performance duration. Dashed linear regression line shown. (b) Histogram of standardized time of signal production in all performances (725 signals, mean = 0.397 ± 0.268). (c) Histogram of the average standardized time of signal production per performance. The number of signals is higher towards the beginning than the end of each performance (mean = 0.434 ± 0.150).